“Education is what survives when what has been learned has been forgotten.” 📈
B. F. Skinner, the brilliant American psychologist who established the paradigm of behaviorist psychology by arguing that human free will is a product of behavioral conditioning, founded applied behavior analysis through countless works and experiments. While he researched various mechanisms to alter the behavior of others, how did he manage his own creative productivity?
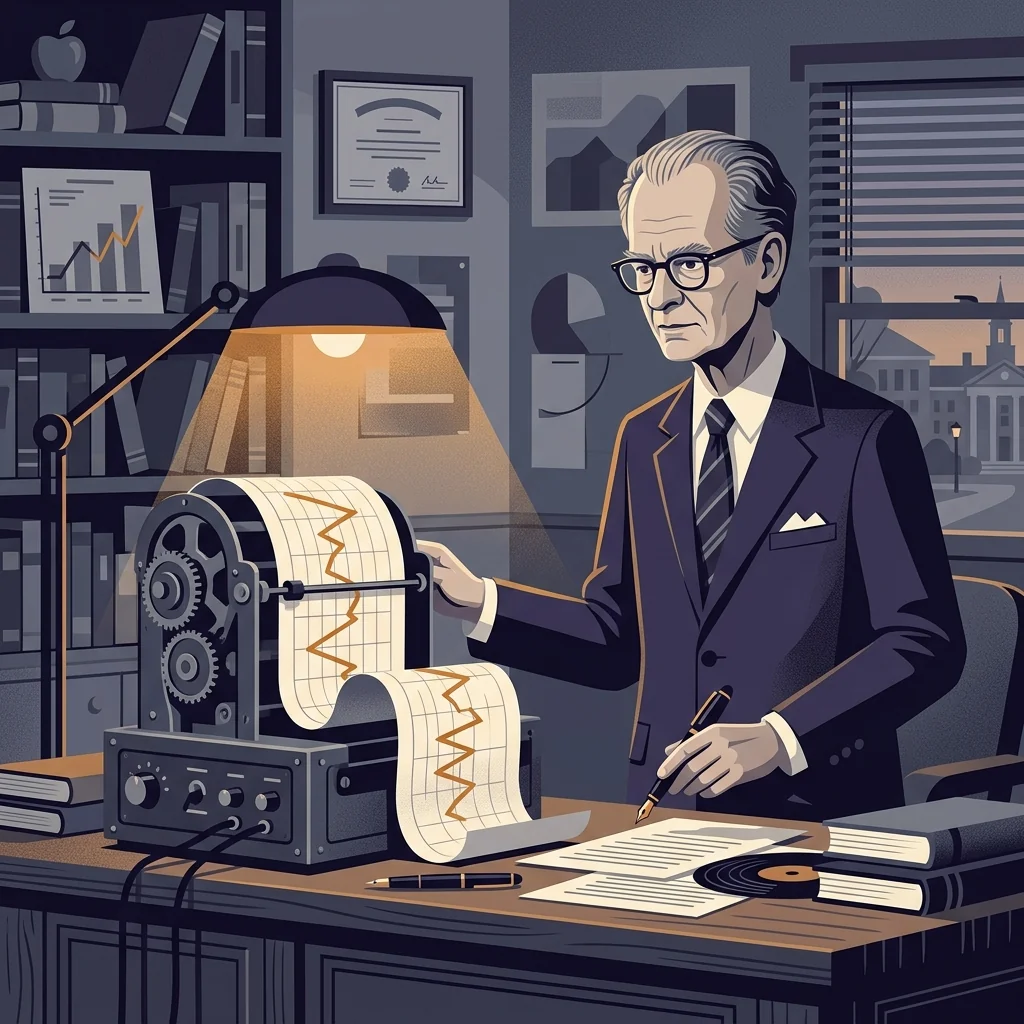
Skinner sat at his desk every day and precisely measured the time he spent purely focused on writing (creative and academic) using a stopwatch. As soon as a session ended, he recorded the exact word count produced that day alongside his net focus time on a log board. Rather than merely collecting these figures, Skinner visualized them daily as line graphs mounted directly on the wall in front of his desk. He perfectly tested and proved on himself the mechanism of ‘Self-Reinforcement’—that motivation is continuously stimulated when behavior is immediately visible as data.
In today’s post, we examine the scientific operating principles of Skinner’s behavioral quantification routine and how modern individuals can apply it to design sustainable growth without giving up halfway.
Historical & Academic Evidence
This content is based on Historical biographies, autobiographical records of Skinner's behavior tracking & Cognitive Neuroscience research.
 BuildSelf
Inspired by historical greats? Make it your daily habit!
BuildSelf
Inspired by historical greats? Make it your daily habit!

















1. The ‘Visual Feedback Effect’ Stimulating Dopamine Circuits
According to behaviorist psychology, the human brain develops a strong tendency to repeat a behavior when it experiences immediate reward or positive feedback right after the action. This is known in operant conditioning as ‘Reinforcement’. Checking exact figures of words written or minutes focused, and visualizing them on a graph, serves as a powerful non-material reward that triggers dopamine release in the brain’s reward prediction system. Rather than relying on vague willpower, this logging habit voluntarily stimulates and solidifies deep focus through a data feedback loop.
2. 3-Step Practical Routine for Modern Professionals
Measure Net Deep Focus Time with a Stopwatch
Start a stopwatch before writing or studying. Pause it immediately whenever focus is broken (e.g., checking phone, leaving desk) to calculate only net accumulated focus minutes.
Log Quantitative Focus Data Immediately After Session
Right after finishing a session, record objective figures such as 'Net Focus Minutes' and 'Words Written / Pages Produced' in a physical planner or spreadsheet.
Plot Daily Cumulative Graphs and Review Visual Feedback
Plot your daily productivity data as a line graph and display it in a prominent location or digital dashboard to visually monitor performance and boost intrinsic motivation.
3. Beware of Metric Manipulation and Means-End Inversion
A common mistake when maintaining a tracking habit is compromising work quality or leaving a timer running aimlessly just to inflate graph numbers or word counts. As Goodhart’s Law states, ‘When a measure becomes a target, it ceases to be a good measure.’ Logging should serve as an objective mirror reflecting your productivity flow, rather than making the numbers themselves the ultimate goal of intellectual labor.
📌 Frequently Asked Questions (FAQ)
Can qualitative creative planning or study also be tracked with quantitative metrics like word count or time? ▼
Yes. For creative planning, instead of word counts, you can define meaningful output units such as 'Number of Core Ideas Generated', 'High-Quality References Collected', or 'Detailed Outline Sections Drafted' to effectively apply visual feedback.